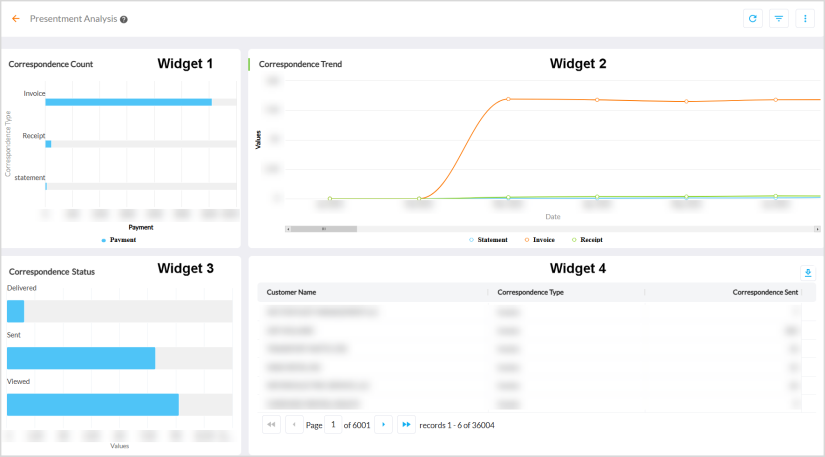
Presentment Analysis
The Presentment Analysis dashboard provides an analysis of the timely Customer payments and the reminders sent via various correspondence methods.
For more details, refer to Viewing Dashboards.
Widget 1 - Correspondence Count
The Correspondence Count widget displays a bar chart of correspondence categories and the respective payments count.

Hovering over the series displays a tooltip of the correspondence category and the respective Payment count.
Widget 2 - Correspondence Trend
The Correspondence Trend widget displays a spline chart of the monthly trend of the payments volume segregated into correspondence categories.
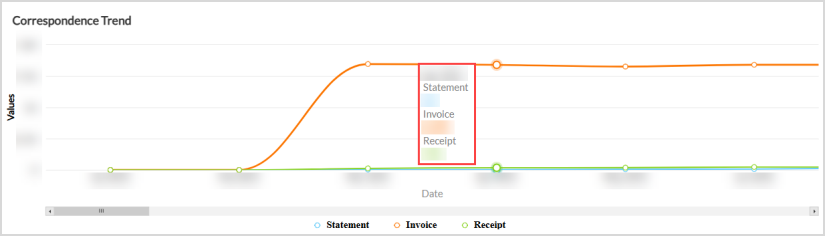
Hovering over the series displays a tooltip of the date on X-axis and the respective payments count in the correspondence categories.
Widget 3 - Correspondence Status
The Correspondence Status widget displays a bar chart of the payments correspondence status.
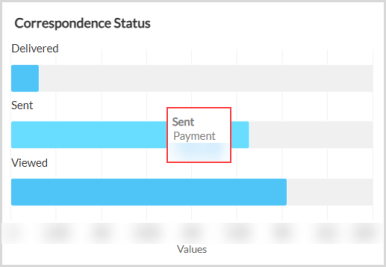
Hovering over the series displays a tooltip of the correspondence status and the respective Payment count.
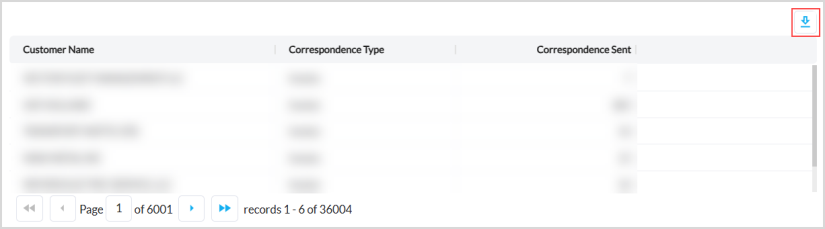
Widget 4 - Grid
The grid displays the entire data considered for the computation of metrics in the dashboard. Click the download icon to export the data as a CSV file in your local system.
Out-of-the-Box Features
The Out-of-the-Box features and functionalities of the dashboard are as follows:
-
Cross Filtering - Slices and dices between multiple dimensions. For example, clicking a correspondence type or status (bar graph) filters the entire data of dashboard for that category.
-
Standard Out-of-the-Box Filters - Filters the entire report based on Company Code.
-
Kebab Menu - Click this icon to access options such as download, schedule, and mark the report as favorite. For more details, refer to Using Kebab Menu Options.